This ENGIE Hazelwood Air Quality Monitoring website provides daily information from an extensive monitoring network across the Hazelwood Rehabilitation Project Site (Hazelwood Site). The Hazelwood Site includes the decommissioned Power Station, the EPA Licenced Asbestos Containment Area and the Hazelwood Mine. The air quality monitoring is focused on four areas – mine dust, demolition dust, demolition dust for hourly trends and asbestos monitoring.
This website provides open and transparent information about dust to our community and is part of ENGIE Hazelwood’s commitment to keep the local community informed about demolition and rehabilitation activities across the Hazelwood Site. Read more...
Dust is also measured by the Environment Protection Authority (EPA) in the Latrobe Valley. To compare data on this website with that measured by EPA in the region, check EPA AirWatch.
Mine Dust

There are seven air quality monitors for PM10 (coarse dust) and PM2.5 (fine dust) located around the Mine Rehabilitation Project. The latest 24-hour average of PM10 and PM2.5 is calculated and presented daily. Data collected over the previous week is presented in the graphs below.
View monitoring »Demolition Dust

There are four air quality monitors for PM10 (coarse dust) and PM2.5 (fine dust) located around the former Hazelwood Power Station. The latest 24-hour average of PM10 and PM2.5 is calculated and presented daily. Data collected over the previous week is presented in the graphs below.
View monitoring »Demolition Dust - Hourly

There are 16 air quality monitors for PM10 (coarse dust) and PM2.5 (fine dust) located around the former Hazelwood Power Station and Asbestos Containment Area. The most recent data is presented in the graphs below.
View monitoring »Asbestos

There are approximately 20 monitors that alternate between 32 locations around the former Hazelwood Power Station, along the Asbestos Containment Area haul routes and around the Asbestos Containment Area. The results of the asbestos sampling and analysis, including historical data, are reported below.
View monitoring »Mine Dust Monitoring

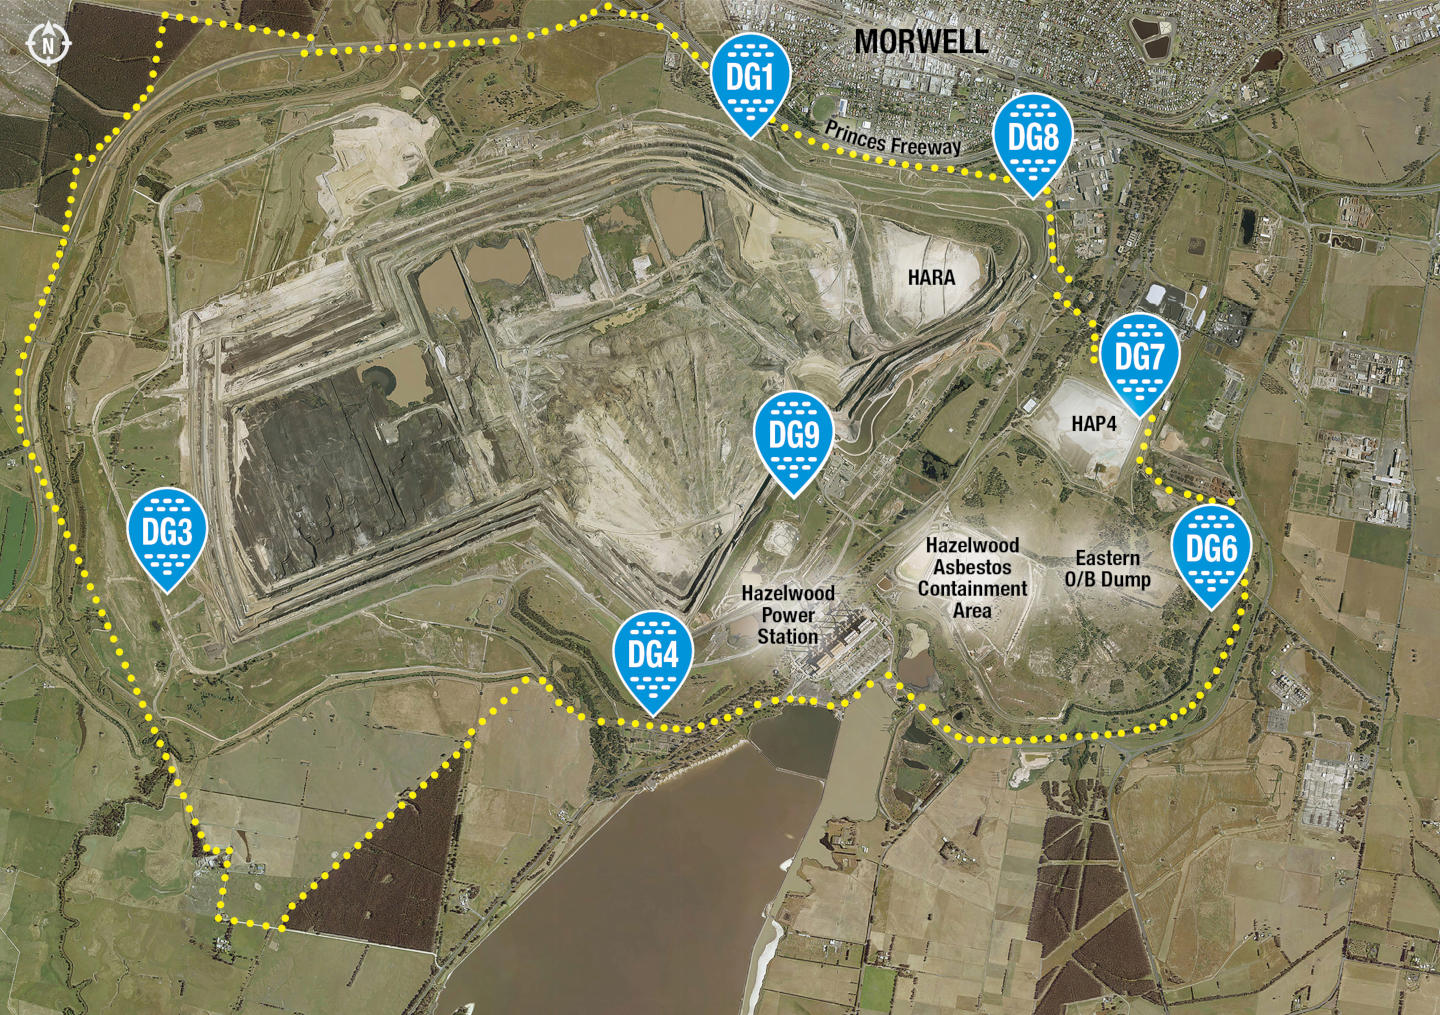
Note: dust monitor locations DG2 and DG5 are historic locations and are no longer monitored.
There are seven air quality monitors for PM10 (coarse dust) and PM2.5 (fine dust) located around the Mine Rehabilitation Project. The most recent daily averages are shown below and data collected over the previous week is presented in the graphs. The latest 24-hour average of PM10 and PM2.5 is calculated and presented daily.
Dust arising from activities at the Hazelwood Rehabilitation Project is compared to the intervention levels set by the State Environment Protection Policy (SEPP) for Air Quality Management (AQM):
- Concentrations of PM10 to be less than 60 µg/m3 as a 24-hour average
- Concentrations of PM2.5 to be less than 36 µg/m3 as a 24-hour average
Latest 24-hour averages
DG1
DG3
DG4
DG6
DG7
DG8
DG9
Weekly data
PM10 (coarse dust)
Data unavailable
The monitor may be experiencing technical issues or undergoing maintenance
PM10 (coarse dust)
PM10 (coarse dust)
PM10 (coarse dust)
Data unavailable
The monitor may be experiencing technical issues or undergoing maintenance
PM10 (coarse dust)
PM10 (coarse dust)
Data unavailable
The monitor may be experiencing technical issues or undergoing maintenance
PM10 (coarse dust)
Data unavailable
The monitor may be experiencing technical issues or undergoing maintenance
PM2.5 (fine dust)
Data unavailable
The monitor may be experiencing technical issues or undergoing maintenance
PM2.5 (fine dust)
PM2.5 (fine dust)
PM2.5 (fine dust)
Data unavailable
The monitor may be experiencing technical issues or undergoing maintenance
PM2.5 (fine dust)
PM2.5 (fine dust)
Data unavailable
The monitor may be experiencing technical issues or undergoing maintenance
PM2.5 (fine dust)
Data unavailable
The monitor may be experiencing technical issues or undergoing maintenance
Demolition Dust Monitoring

Note: these monitors are in the same network as the demolition dust - hourly monitors and are numbered accordingly.
There are four air quality monitors for PM10 (coarse dust) and PM2.5 (fine dust) located around the former Hazelwood Power Station. The most recent daily averages are shown below and data collected over the previous week is presented in the graphs. The latest 24-hour averages of PM10 and PM2.5 are calculated and presented daily. These values can be compared to the State Environment Protection Policy (SEPP) for Air Quality Management (AQM) intervention levels. More information...
Latest 24-hour averages
DD3
DD4
DD9
DD11
Weekly data
PM10 (coarse dust)
PM10 (coarse dust)
PM10 (coarse dust)
PM10 (coarse dust)
PM2.5 (fine dust)
PM2.5 (fine dust)
PM2.5 (fine dust)
PM2.5 (fine dust)
Demolition Dust Monitoring - 1-hour averages

Note: these monitors are in the same network as the demolition dust monitors and are numbered accordingly.
There are 16 air quality monitors for PM10 (coarse dust) and PM2.5 (fine dust) located around the former Hazelwood Power Station and Asbestos Containment Area. These devices monitor dust concentrations in real-time and are located close to activities that are associated with the demolition of the Station. These dust monitors typically operate for eight hours each day to coincide with demolition works. Live data is displayed in graphs below.
The data presented is measured in real-time throughout the day. The dust data presented is related to "nuisance dust" to workers and others in the vicinity of works. The measurements are not a 24-hour average. While there are no exposure standards for nuisance dust, as a reference Safe Work Australia have recommended exposure to dusts should be maintained below 10 mg/m3 (10,000 µg/m3), measured as inhalable dust. During demolition works, spikes in dust concentrations may occur due to works concentrated in a particular area of the demolition site. More information...
Daily data
PM10 (coarse dust)
Data unavailable
The monitor may be experiencing technical issues or undergoing maintenance
PM10 (coarse dust)
Data unavailable
The monitor may be experiencing technical issues or undergoing maintenance
PM10 (coarse dust)
Data unavailable
The monitor may be experiencing technical issues or undergoing maintenance
PM10 (coarse dust)
Data unavailable
The monitor may be experiencing technical issues or undergoing maintenance
PM10 (coarse dust)
Data unavailable
The monitor may be experiencing technical issues or undergoing maintenance
PM10 (coarse dust)
Data unavailable
The monitor may be experiencing technical issues or undergoing maintenance
PM10 (coarse dust)
Data unavailable
The monitor may be experiencing technical issues or undergoing maintenance
PM10 (coarse dust)
Data unavailable
The monitor may be experiencing technical issues or undergoing maintenance
PM10 (coarse dust)
Data unavailable
The monitor may be experiencing technical issues or undergoing maintenance
PM10 (coarse dust)
Data unavailable
The monitor may be experiencing technical issues or undergoing maintenance
PM10 (coarse dust)
Data unavailable
The monitor may be experiencing technical issues or undergoing maintenance
PM10 (coarse dust)
Data unavailable
The monitor may be experiencing technical issues or undergoing maintenance
PM10 (coarse dust)
Data unavailable
The monitor may be experiencing technical issues or undergoing maintenance
PM10 (coarse dust)
Data unavailable
The monitor may be experiencing technical issues or undergoing maintenance
PM10 (coarse dust)
Data unavailable
The monitor may be experiencing technical issues or undergoing maintenance
PM10 (coarse dust)
Data unavailable
The monitor may be experiencing technical issues or undergoing maintenance
PM2.5 (fine dust)
Data unavailable
The monitor may be experiencing technical issues or undergoing maintenance
PM2.5 (fine dust)
Data unavailable
The monitor may be experiencing technical issues or undergoing maintenance
PM2.5 (fine dust)
Data unavailable
The monitor may be experiencing technical issues or undergoing maintenance
PM2.5 (fine dust)
Data unavailable
The monitor may be experiencing technical issues or undergoing maintenance
PM2.5 (fine dust)
Data unavailable
The monitor may be experiencing technical issues or undergoing maintenance
PM2.5 (fine dust)
Data unavailable
The monitor may be experiencing technical issues or undergoing maintenance
PM2.5 (fine dust)
Data unavailable
The monitor may be experiencing technical issues or undergoing maintenance
PM2.5 (fine dust)
Data unavailable
The monitor may be experiencing technical issues or undergoing maintenance
PM2.5 (fine dust)
Data unavailable
The monitor may be experiencing technical issues or undergoing maintenance
PM2.5 (fine dust)
Data unavailable
The monitor may be experiencing technical issues or undergoing maintenance
PM2.5 (fine dust)
Data unavailable
The monitor may be experiencing technical issues or undergoing maintenance
PM2.5 (fine dust)
Data unavailable
The monitor may be experiencing technical issues or undergoing maintenance
PM2.5 (fine dust)
Data unavailable
The monitor may be experiencing technical issues or undergoing maintenance
PM2.5 (fine dust)
Data unavailable
The monitor may be experiencing technical issues or undergoing maintenance
PM2.5 (fine dust)
Data unavailable
The monitor may be experiencing technical issues or undergoing maintenance
PM2.5 (fine dust)
Data unavailable
The monitor may be experiencing technical issues or undergoing maintenance
Asbestos Monitoring

There are approximately 20 monitors located around the former Hazelwood Power Station, along the Asbestos Containment Area haul routes and around the Asbestos Containment Area. These monitors have been installed to detect airborne fibres below three micrometres in width if emitted by the demolition activities of the Power Station. Each day, the monitors are deployed to 20 of the 32 locations, based on forecast daily weather conditions such as wind direction and strength. Each monitor collects a sample of dust, which is analysed for asbestos fibres.
The asbestos sampling and analysis results are reported as the number of fibres per millilitre of air sampled (fibres/mL). Results less than 0.01 fibres/mL are considered to be at background levels and reported as <0.01. Past dates can be selected to view historical data.
The asbestos analysis is conducted in two stages. First, a preliminary screening analysis detects the presence of airborne fibres less than three micrometres in width regardless of whether they are asbestos fibres. Second, if such fibres are detected, the samples are submitted to an external laboratory to confirm whether or not they contain asbestos fibres. A comment will be shown below these results to indicate whether they are preliminary or final. More information...
Daily data
Monitor | Result (fibres/mL) | Monitor | Result (fibres/mL) | Monitor | Result (fibres/mL) | Monitor | Result (fibres/mL) |
---|---|---|---|---|---|---|---|
AM1 | <0.01 | AM9 | <0.01 | AM17 | <0.01 | AM25 | Not Monitored |
AM2 | <0.01 | AM10 | <0.01 | AM18 | <0.01 | AM26 | <0.01 |
AM3 | <0.01 | AM11 | Not Monitored | AM19 | Not Monitored | AM27 | Not Monitored |
AM4 | <0.01 | AM12 | Not Monitored | AM20 | Not Monitored | AM28 | Not Monitored |
AM5 | <0.01 | AM13 | <0.01 | AM21 | <0.01 | AM29 | Not Monitored |
AM6 | Not Monitored | AM14 | <0.01 | AM22 | <0.01 | AM30 | Not Monitored |
AM7 | <0.01 | AM15 | <0.01 | AM23 | Not Monitored | AM31 | Not Monitored |
AM8 | <0.01 | AM16 | <0.01 | AM24 | Not Monitored | AM32 | Not Monitored |
Disclaimer
Particulate matter data that is presented on this website is collected in real-time and is unvalidated. Data may be affected by instrument error and/or external influences such as prescribed burns.